Cyclistic Bike-Share
As a data analyst, I want to understand how casual riders and annual members use bikes differently. From these insights, the team will design a new marketing strategy to convert casual riders into annual members.
I used Microsoft SQL Server and Microsoft Power BI to clean, transform, and analyze the data in this project.
Scenario
Cyclistic: A bike-share program with over 6,000 bicycles and 600 docking stations in Chicago. The bikes can be unlocked from one station and returned to any other station in the system. Until now, Cyclistic’s marketing strategy relied on building general awareness and appealing to broad consumer segments. One approach that helped make these things possible was the flexibility of its pricing plans: single-ride passes, full-day passes, and annual memberships. Customers who purchase single-ride or full-day passes are referred to as casual riders. Customers who purchase annual memberships are Cyclistic members.
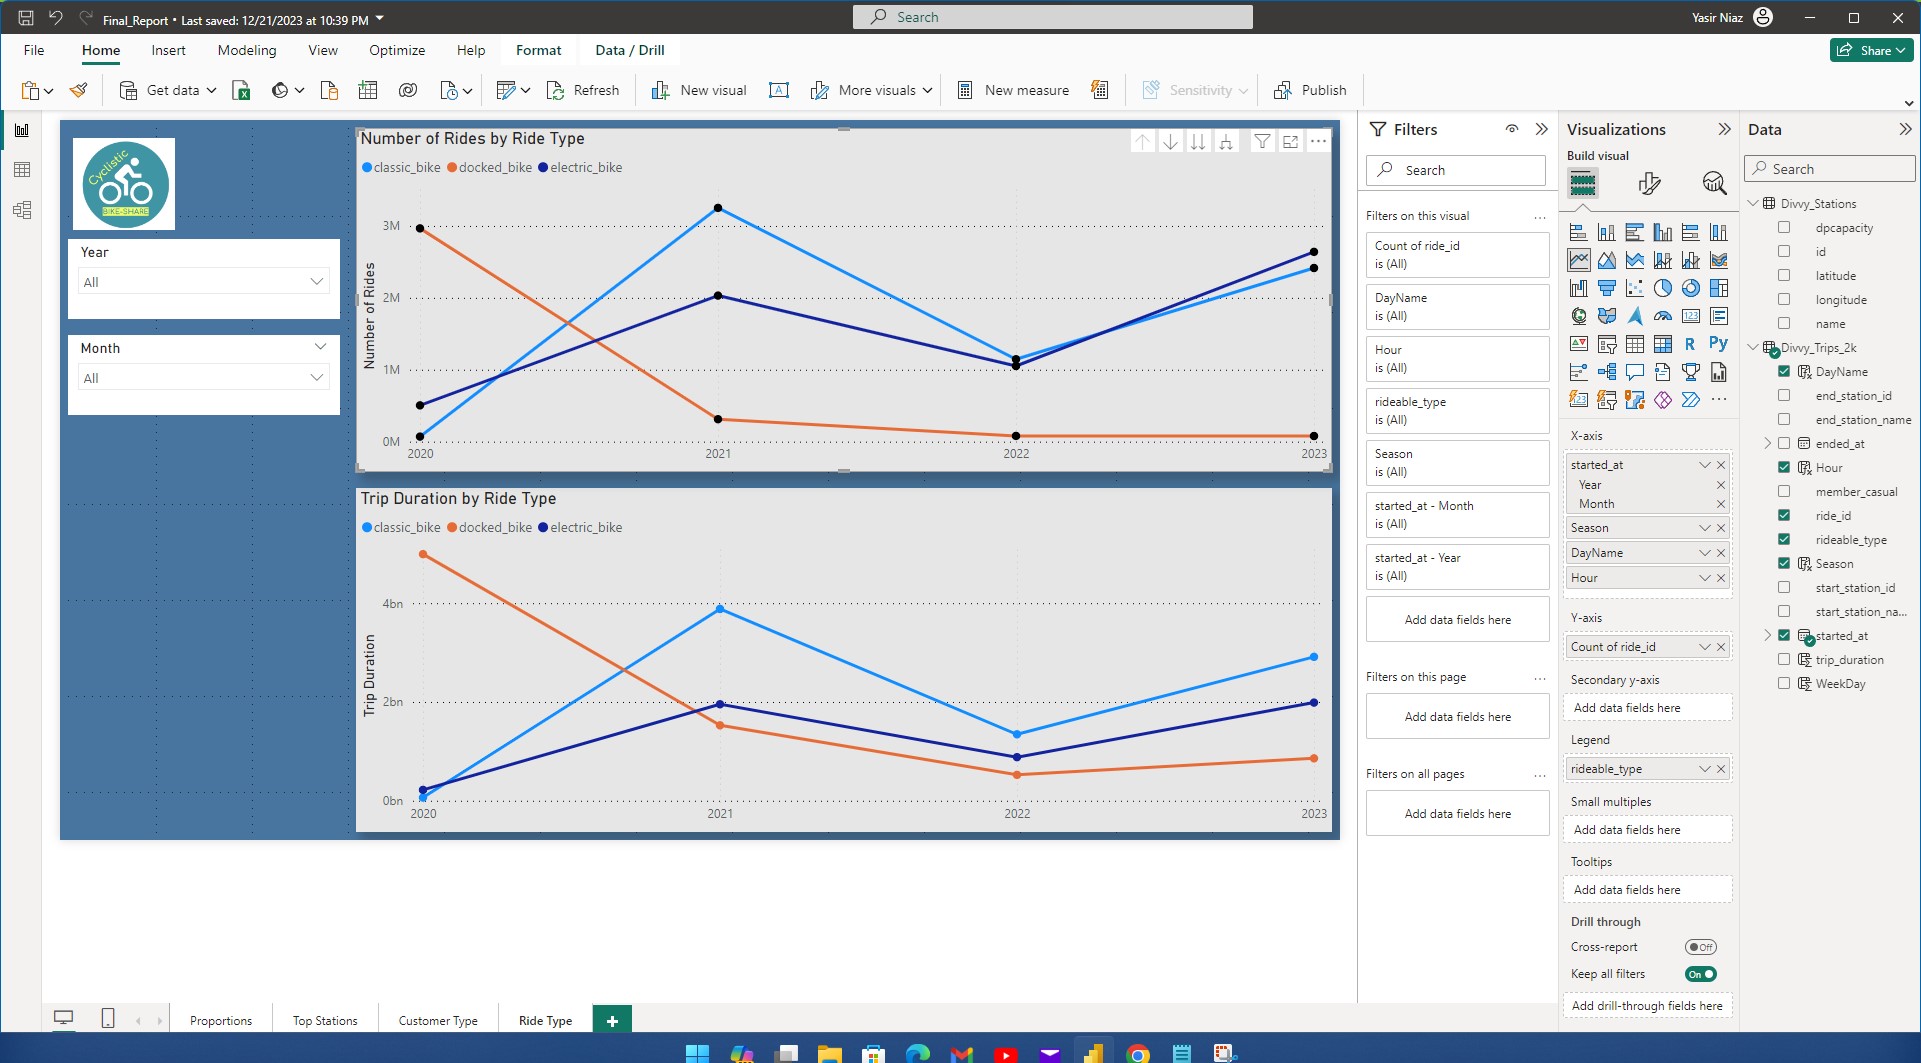
Bike Types: Cyclistic offers three types of bikes.
1. Classic Bike
2. Electric Bike (Original and Next-gen)
3. Docked (Scooters)
The marketing director believes the company’s future success depends on maximizing the number of annual memberships. Therefore, it is important to understand how casual riders and annual members use Cyclistic bikes differently. From these insights, the team will design a new marketing strategy to convert casual riders into annual members.
The recommendations must be backed up with compelling data insights and professional data visualizations.
Ride Pricing
Ride Type | Single Ride | Day Pass | Membership |
|---|---|---|---|
$1 + $0.17/min | $16.50/day | $130.90/year | |
Classic Bike | $1 unlock + $0.17/min | 3 hours free, then $0.17/min | 45 min free, then $0.17/min |
Docked (Scooter) | $1 unlock + $0.42/min | Free unlocks + $0.42/min | Free unlokcs + $0.27/min |
E-Bike | $1 unlock + $0.42/min | Free unlocks + $0.42/min | Free unlocks + $0.17/min |
Data
Cyclistic is a fictional company; however, the data is from a real bike-sharing company, Divvy, in Chicago.
Historical trip data is available for public use.
This data is provided according to the Divvy Data License Agreement and released monthly.
Each trip is anonymized and includes:
-
Trip start day and time
-
Trip end day and time
-
Trip start station
-
Trip end station
-
Rider type (Member, Single Ride, and Day Pass)
The data has been processed to remove trips taken by staff as they service and inspect the system; and any trips below 60 seconds in length (potentially false starts or users trying to re-dock a bike to ensure it was secure).
The data about the identity of the customers and financial transactions is removed from the public dataset.
The data is available in zip files. To understand recent trends I decided to use the trip data from the year 2020 onwards.


After downloading all zip files, I extracted them in separate folders per year. There is one file for each month but sometimes we have it quarterly or mixed, as you can see for the year 2020.
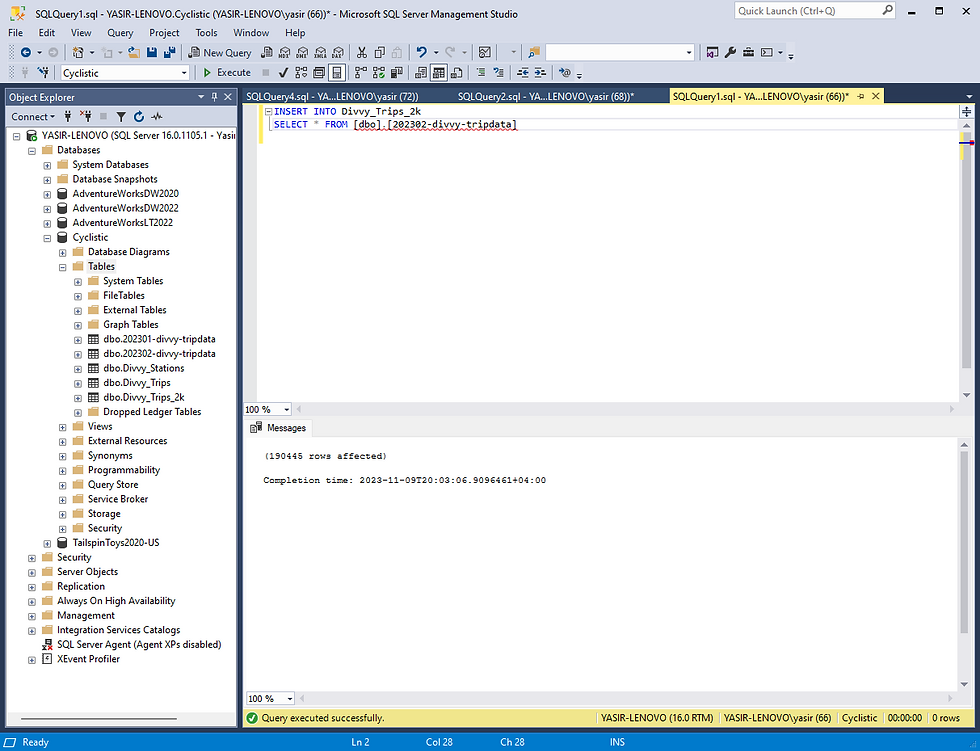
Microsoft SQL Server
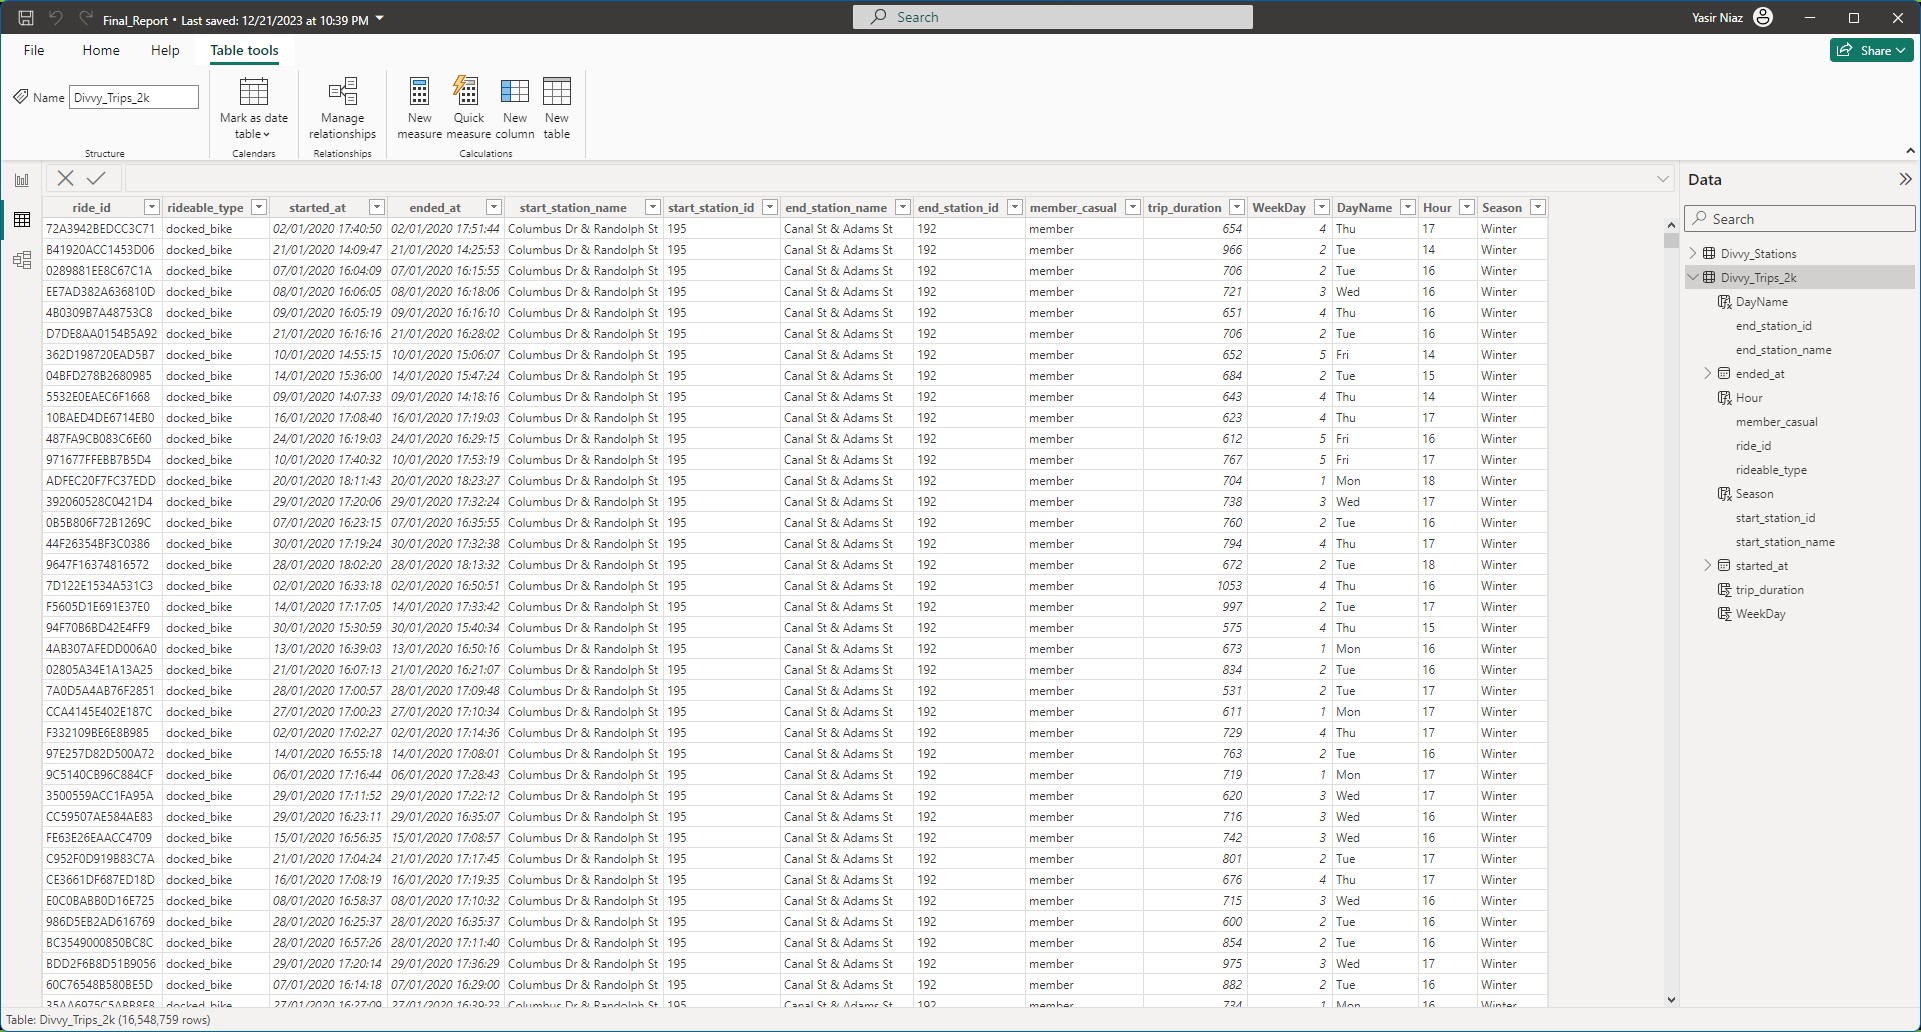
I created a database in Microsoft SQL Server and imported each CSV file into its separate table. Once all data is imported for a year, then I merged them into one table for that year. This way I have the data for the whole year available in one table.
Once I had all data imported from the year 2020 till October 2023, I then again merged it all into one table. The total number of rows reach 16 million.


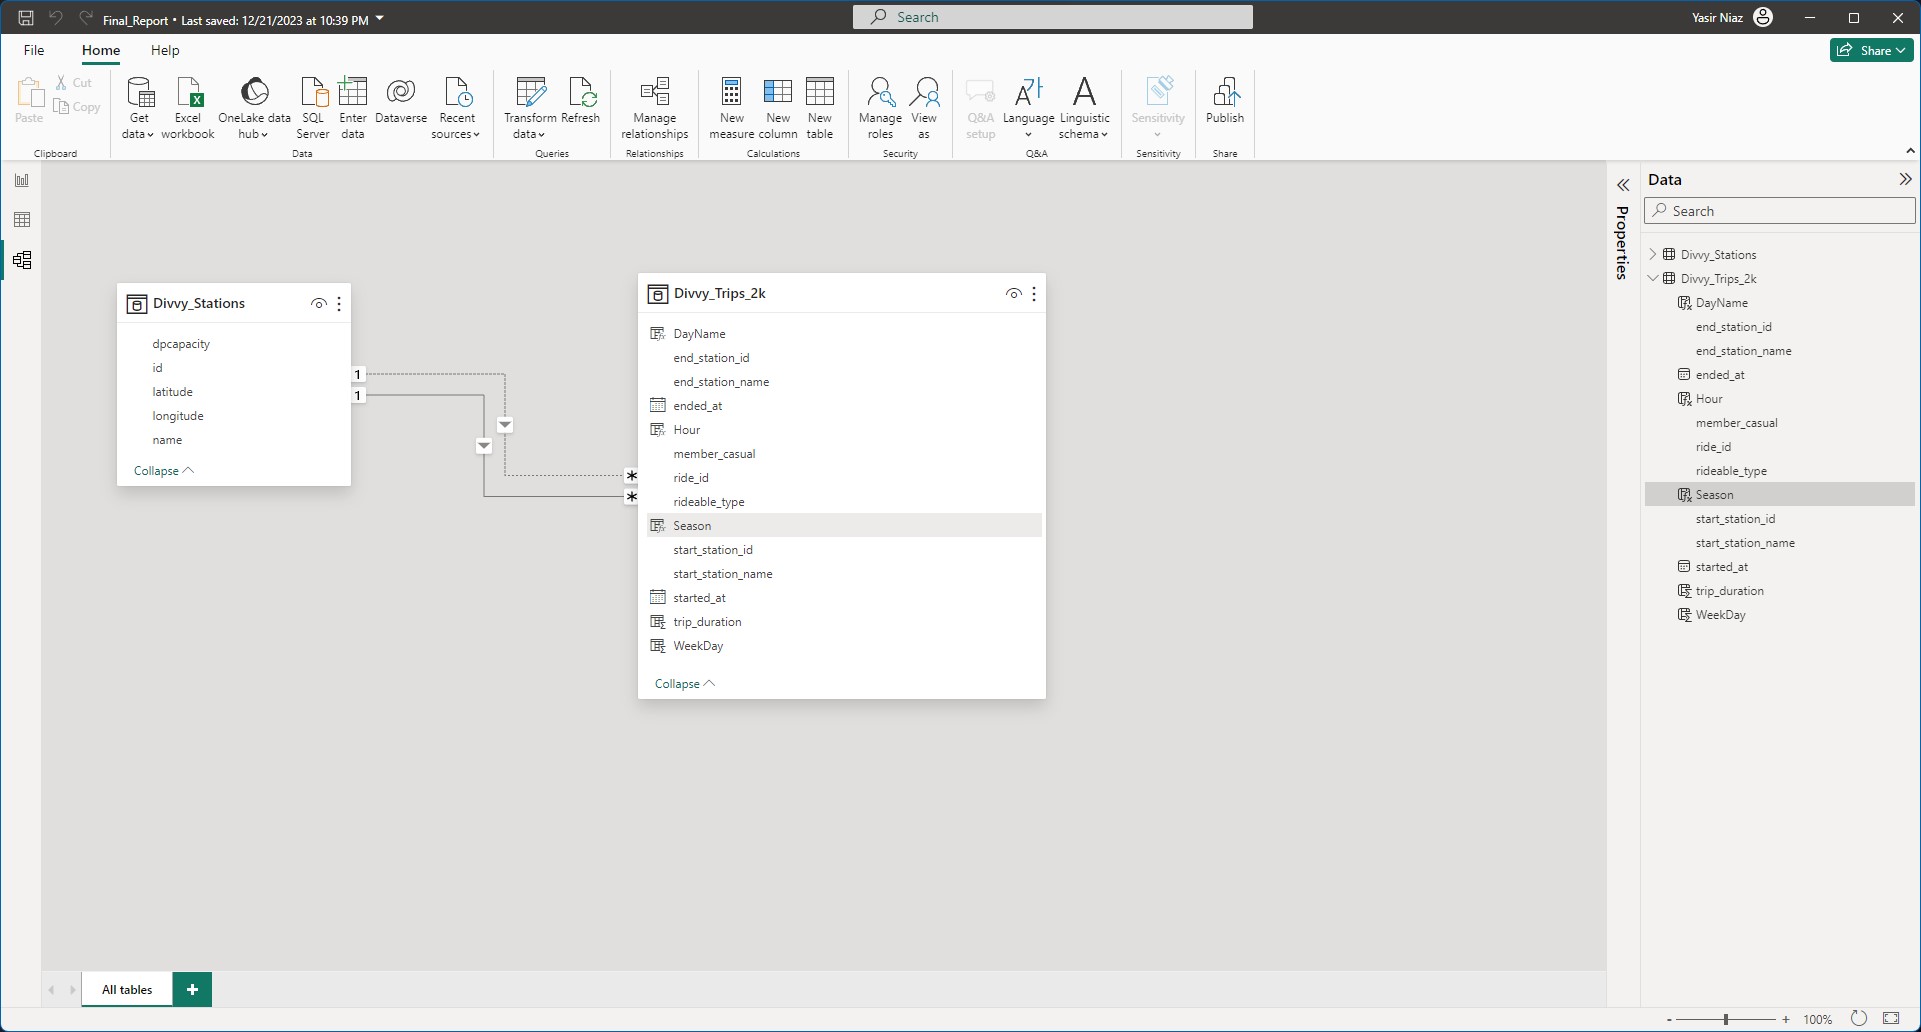
Microsoft Power BI - Desktop
Click on the below image to view it enlarged.
Microsoft Power BI - Desktop
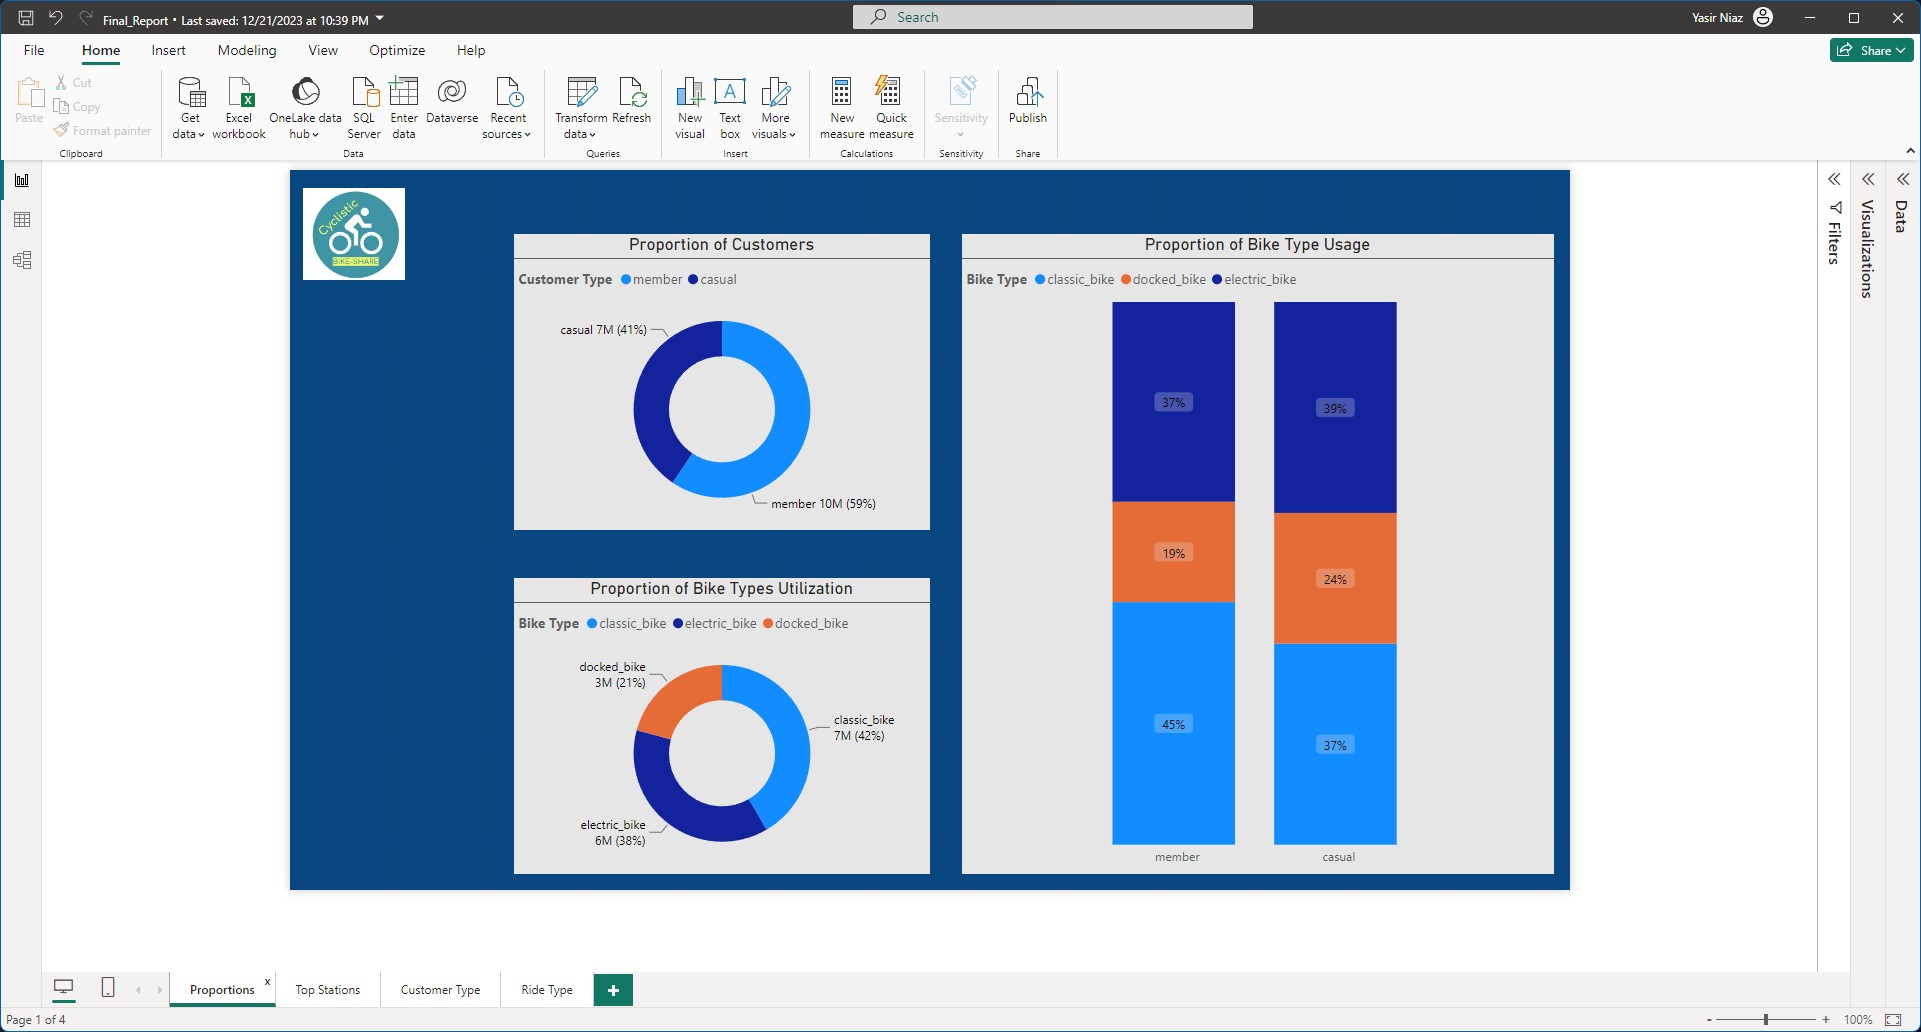
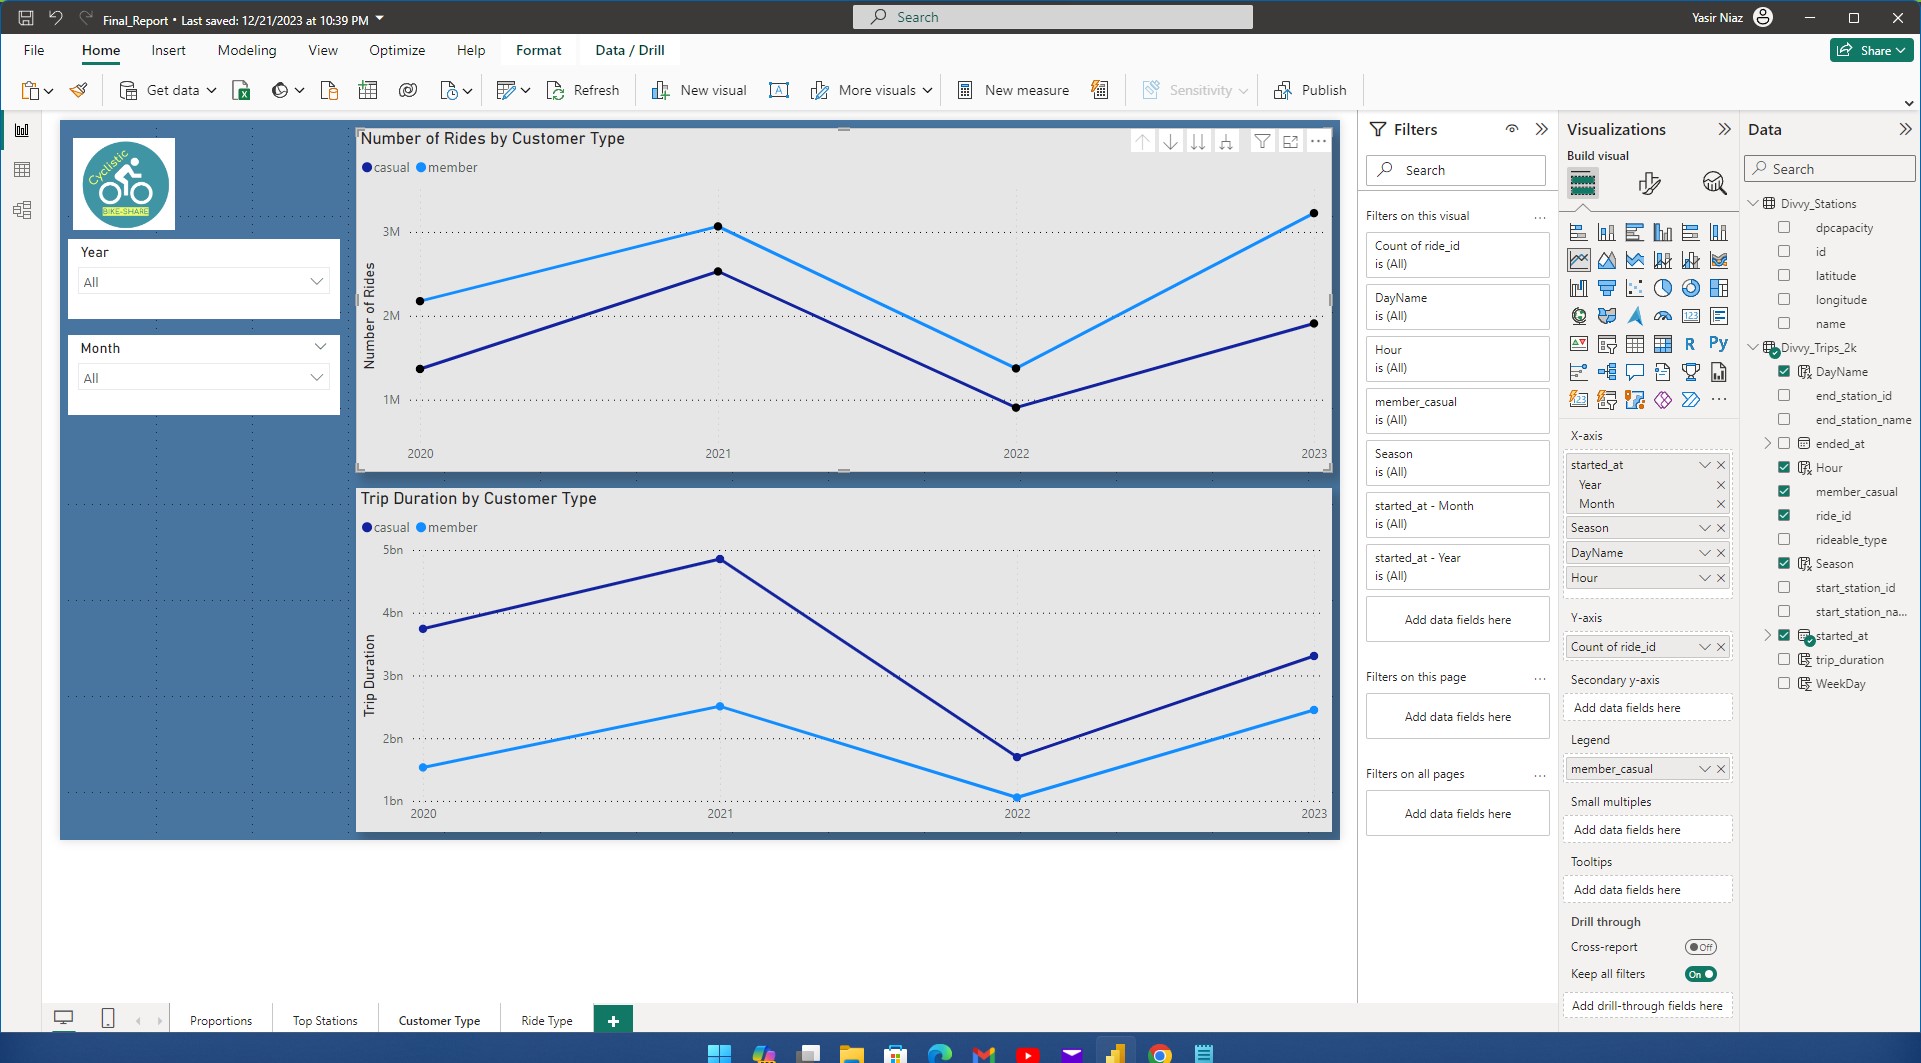
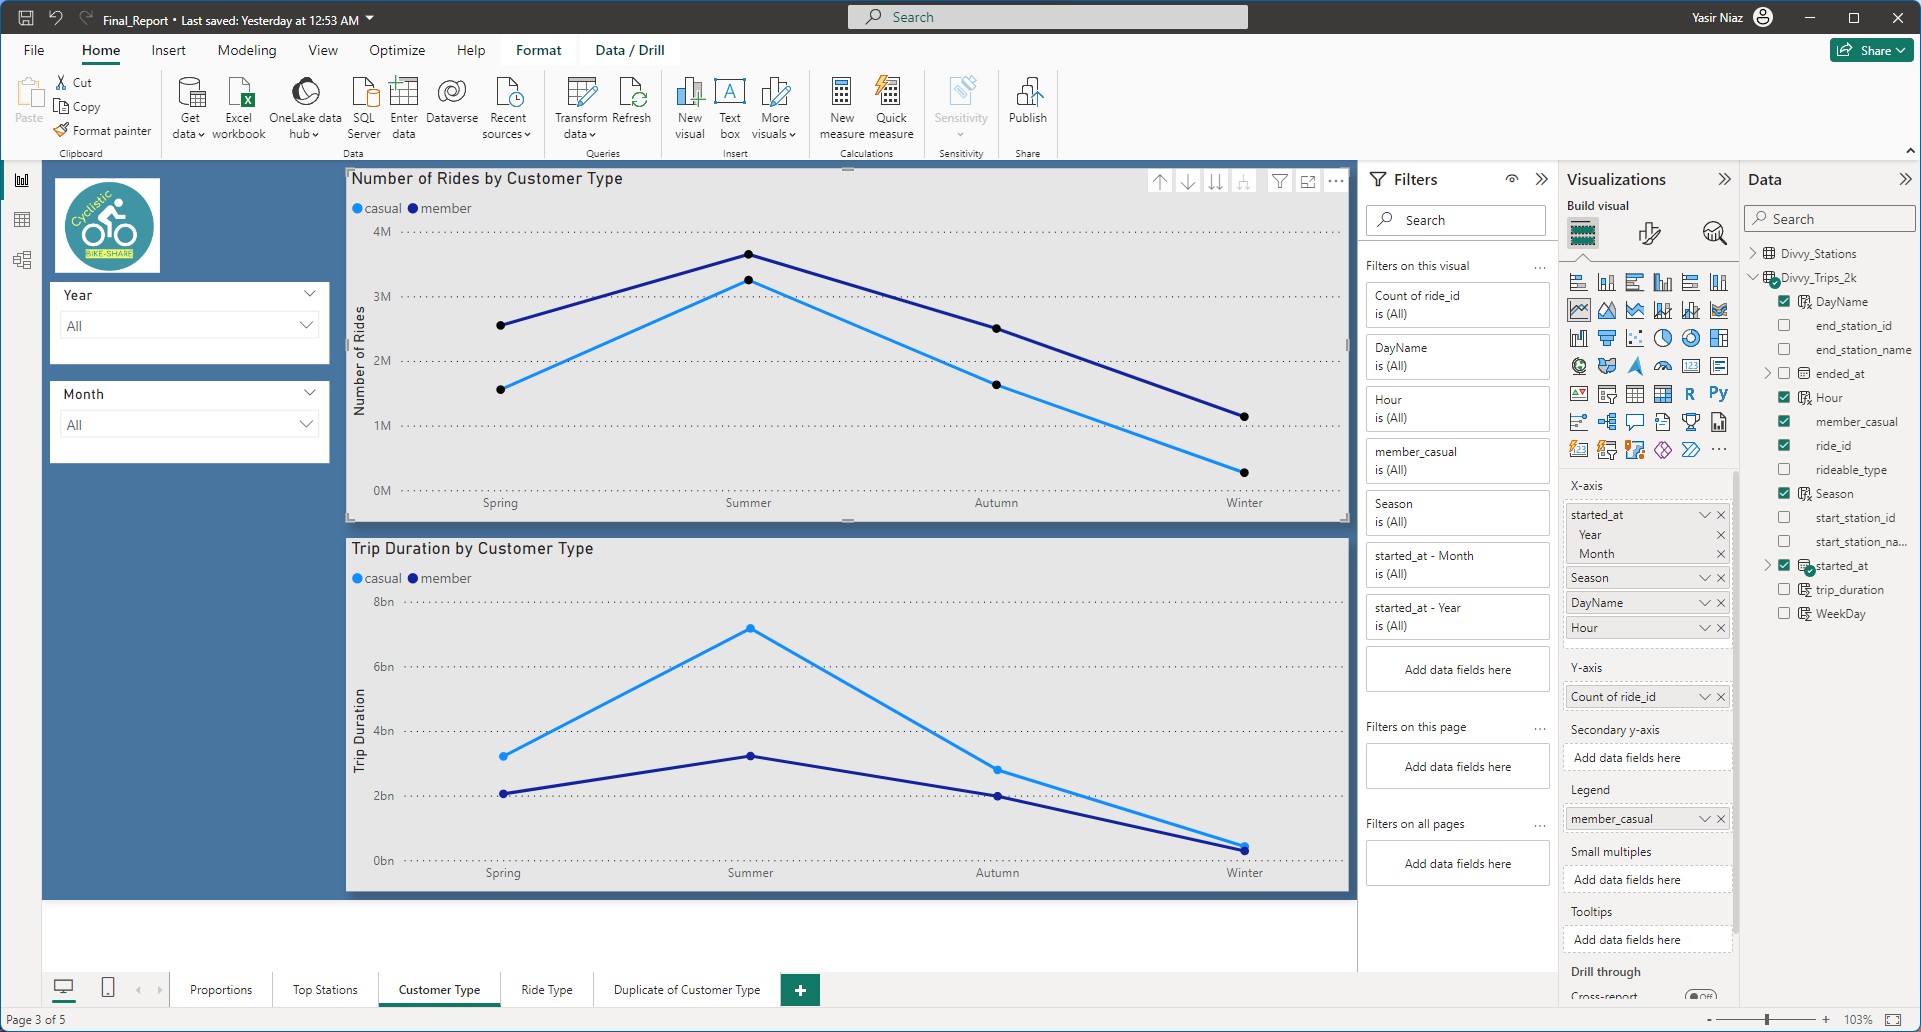
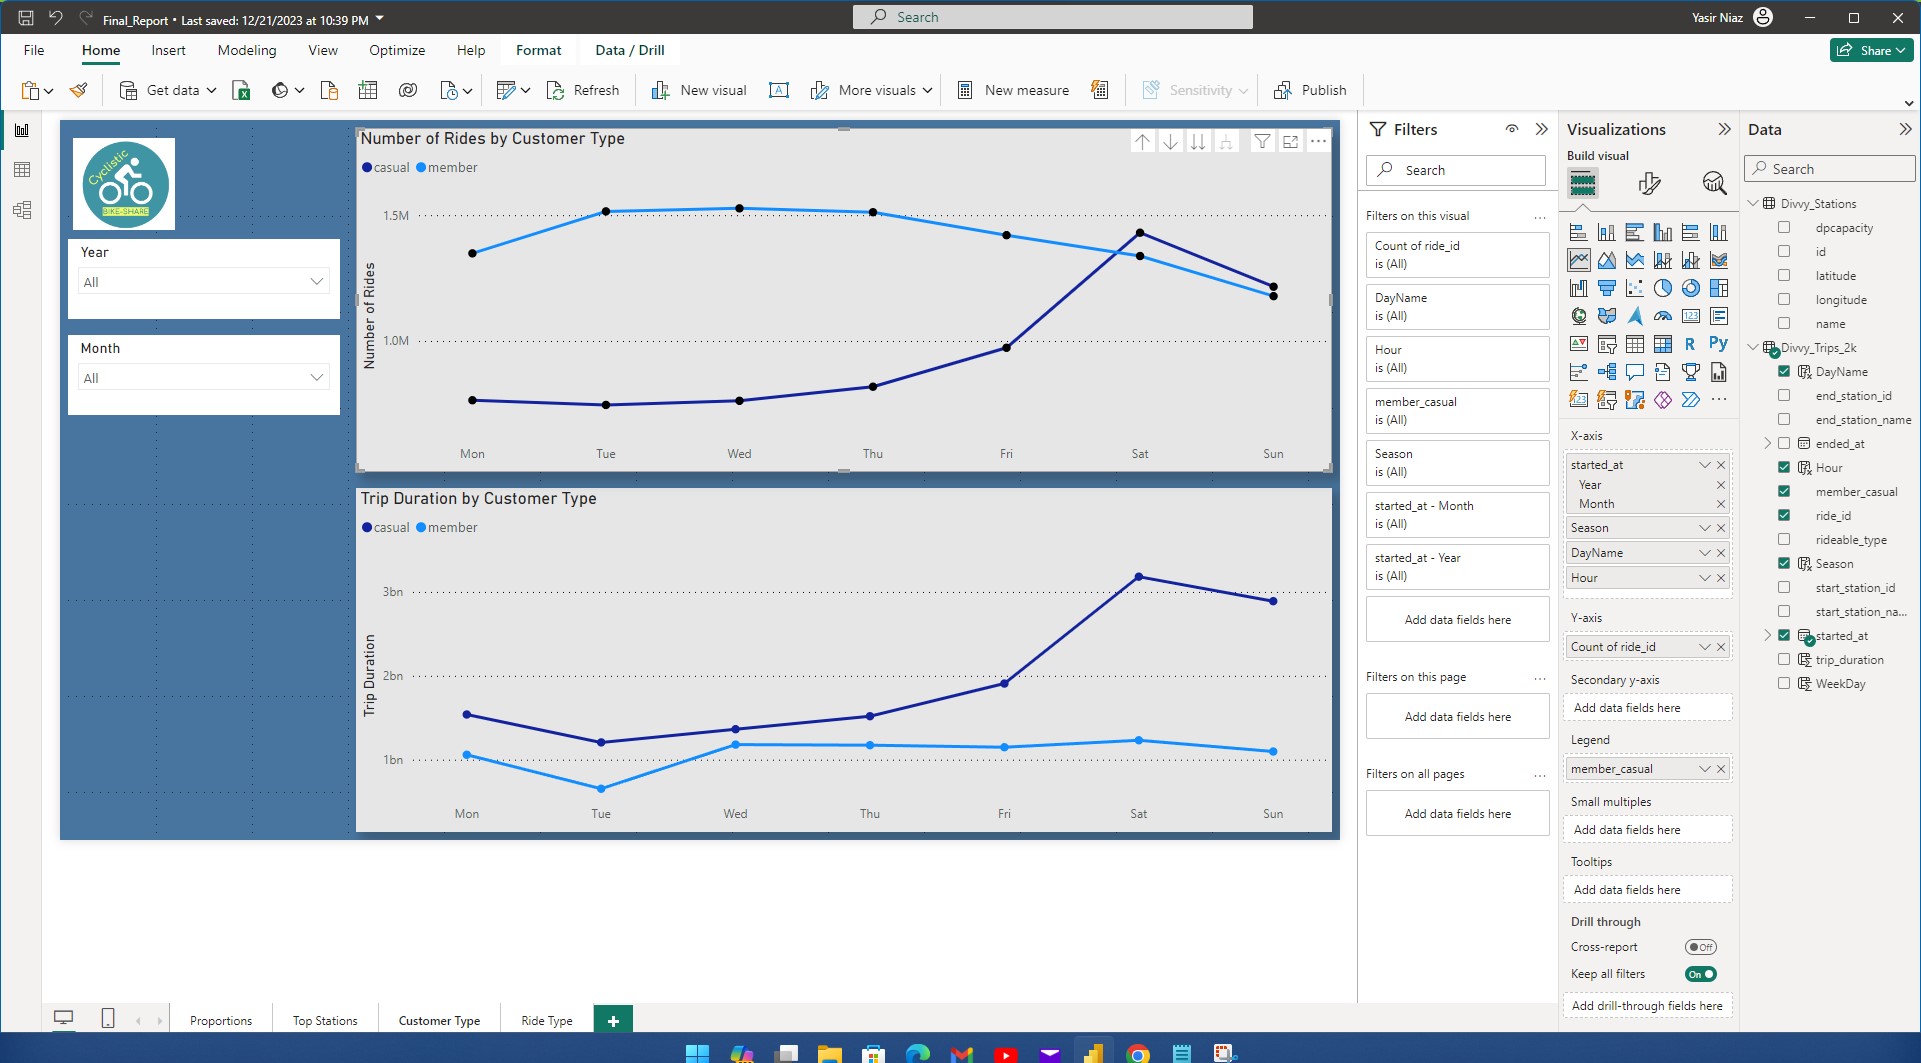
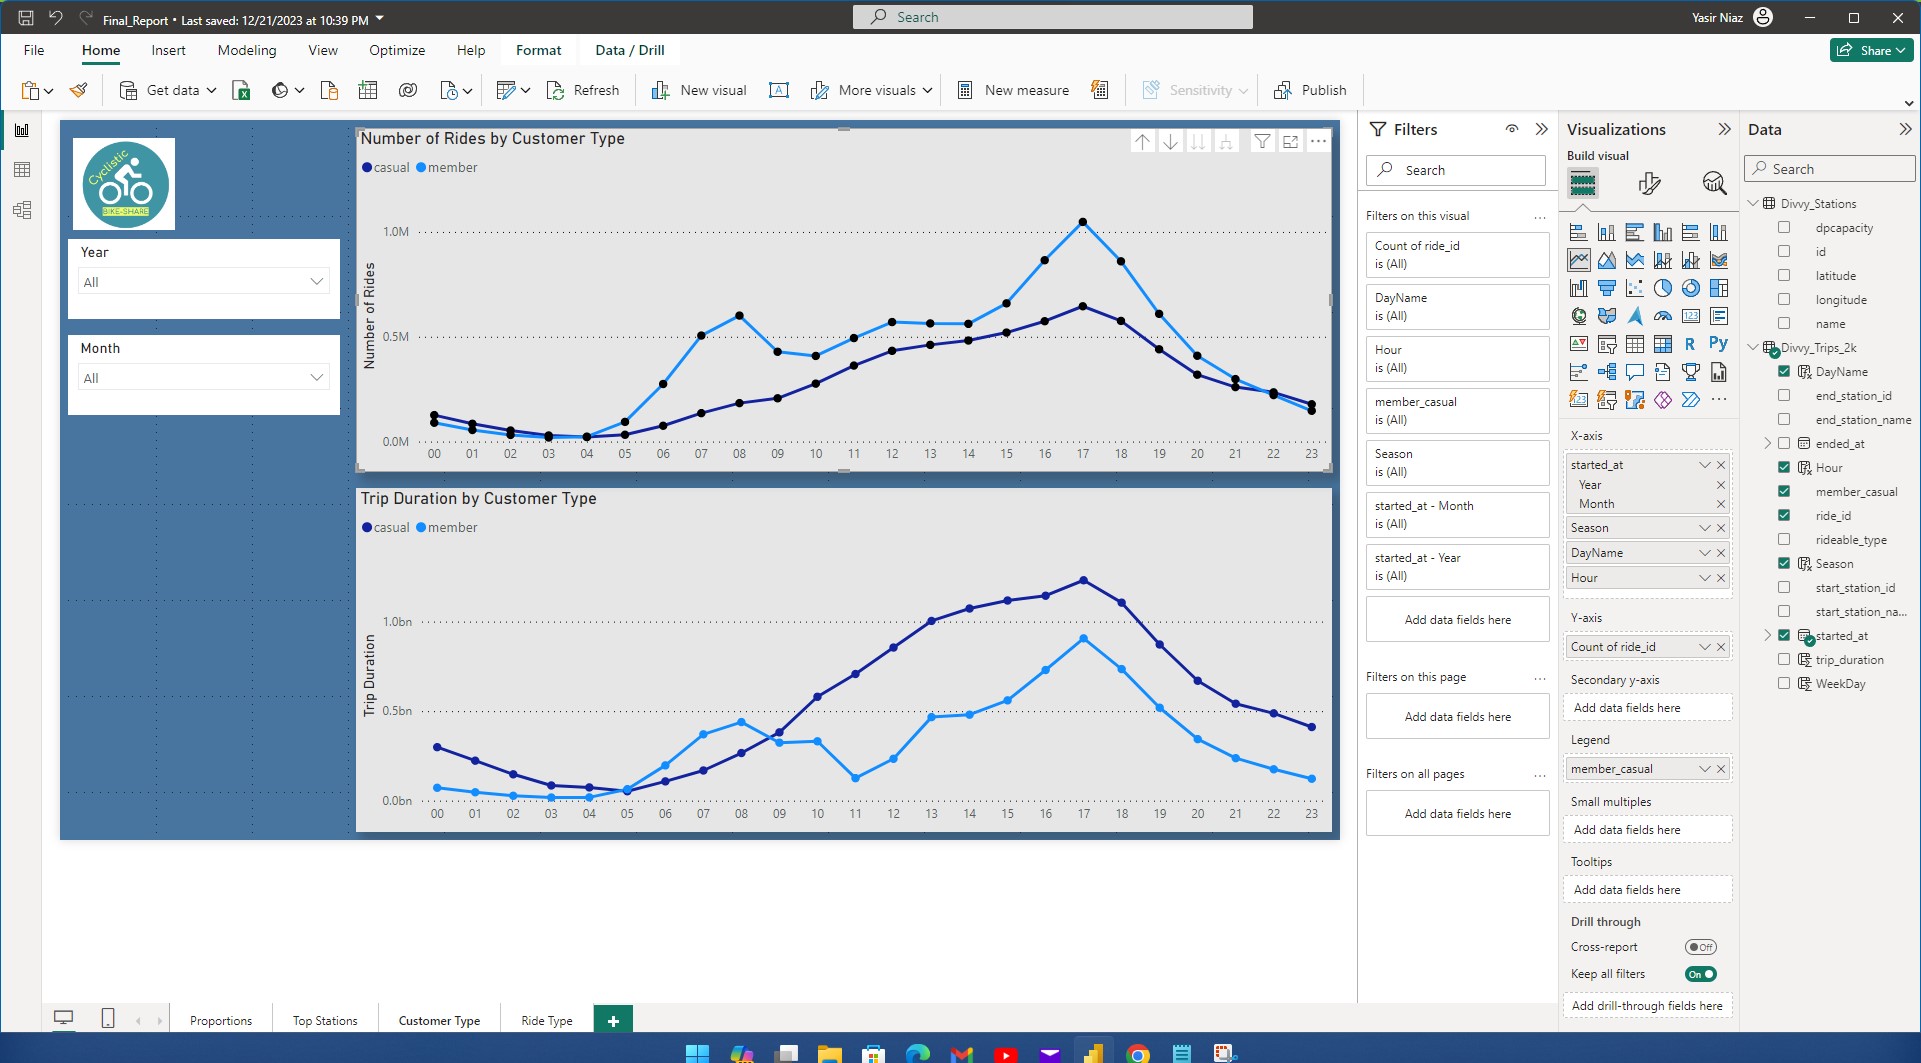
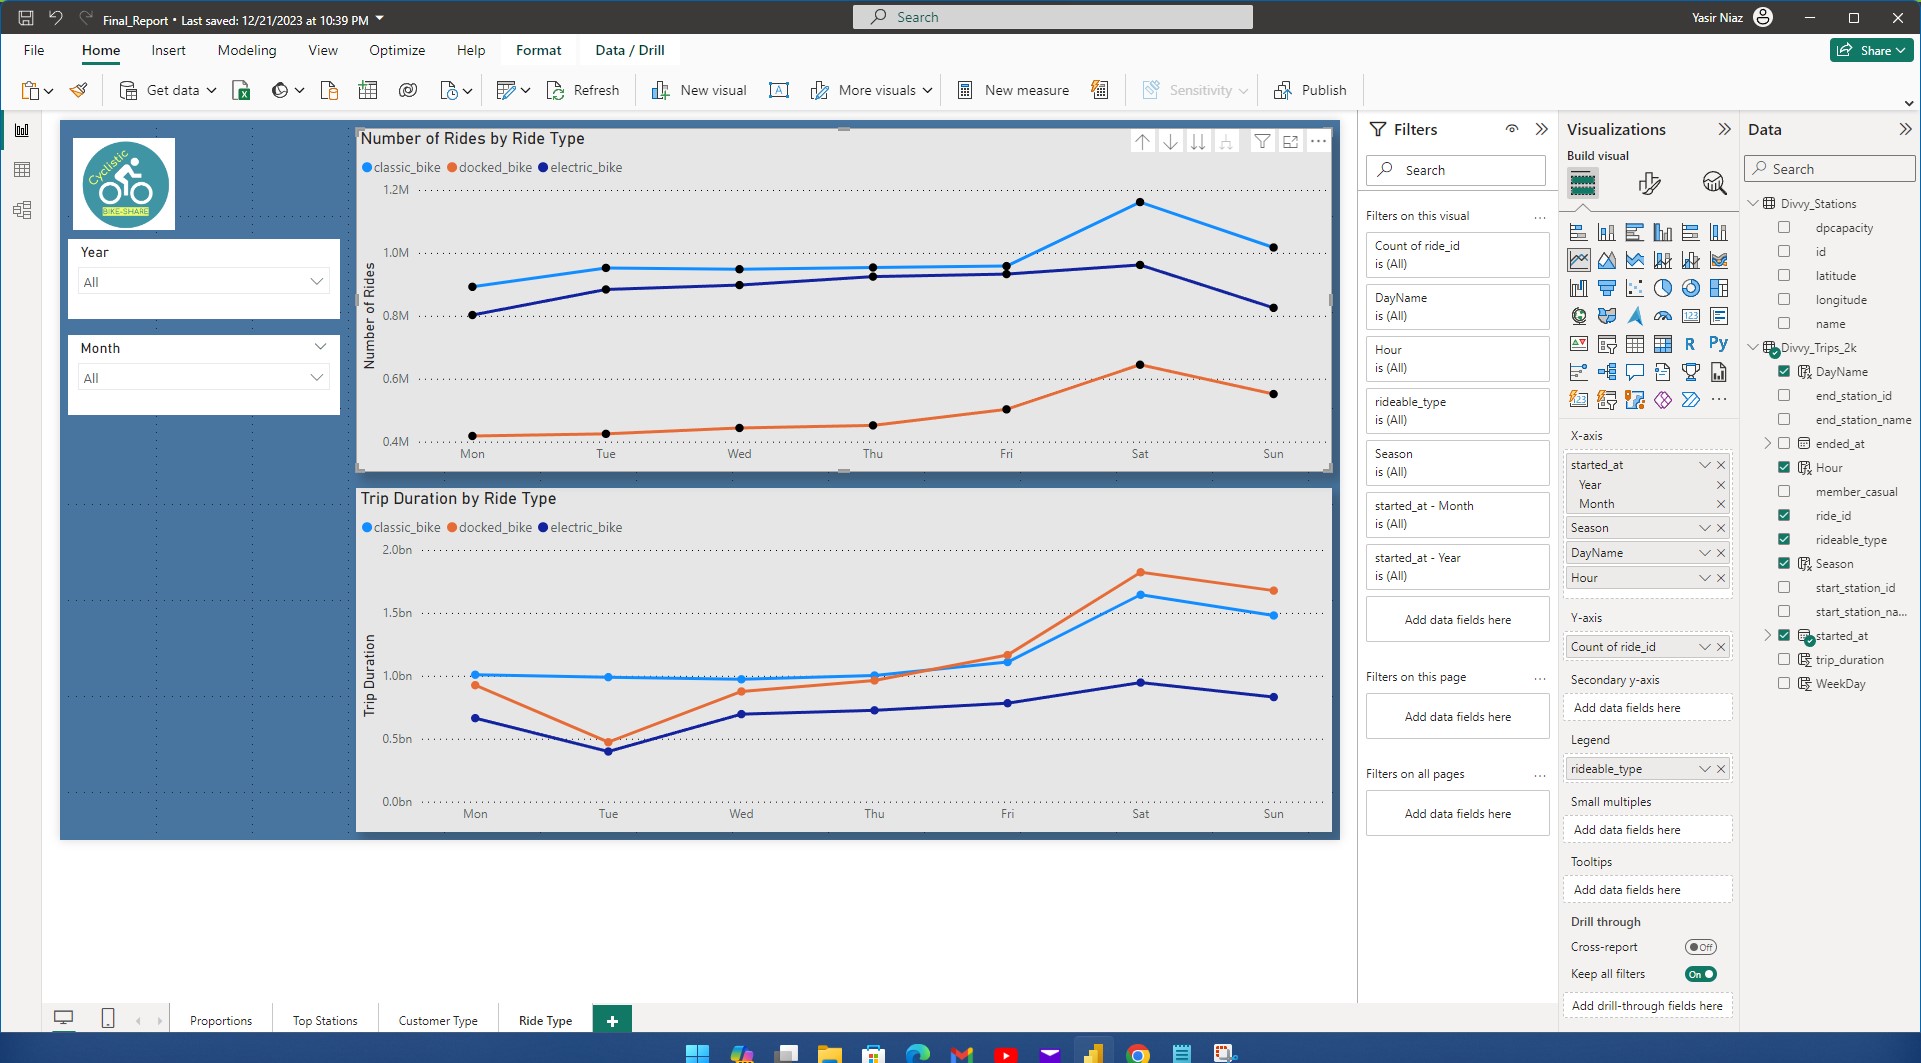
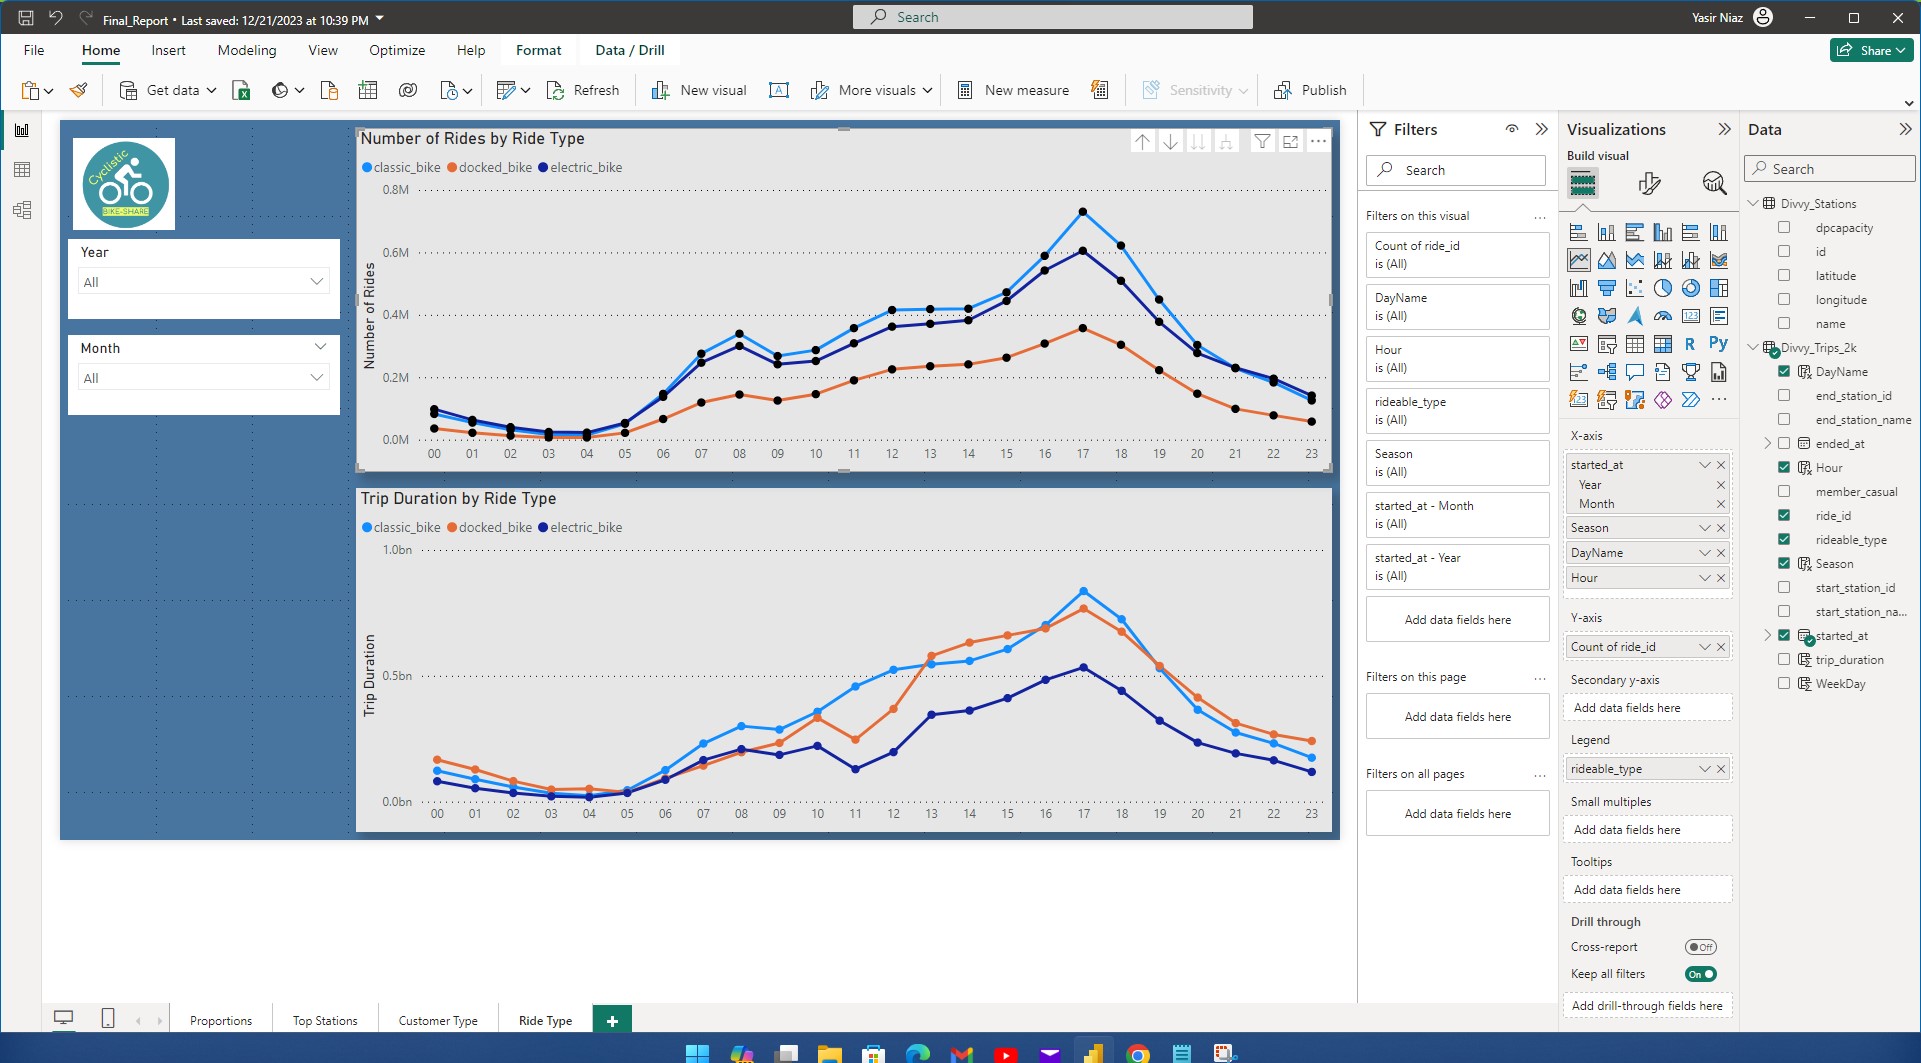
The charts below show the comparison between the usage of casual riders and members.
The top chart shows the number of rides and the below chart shows the trip duration.
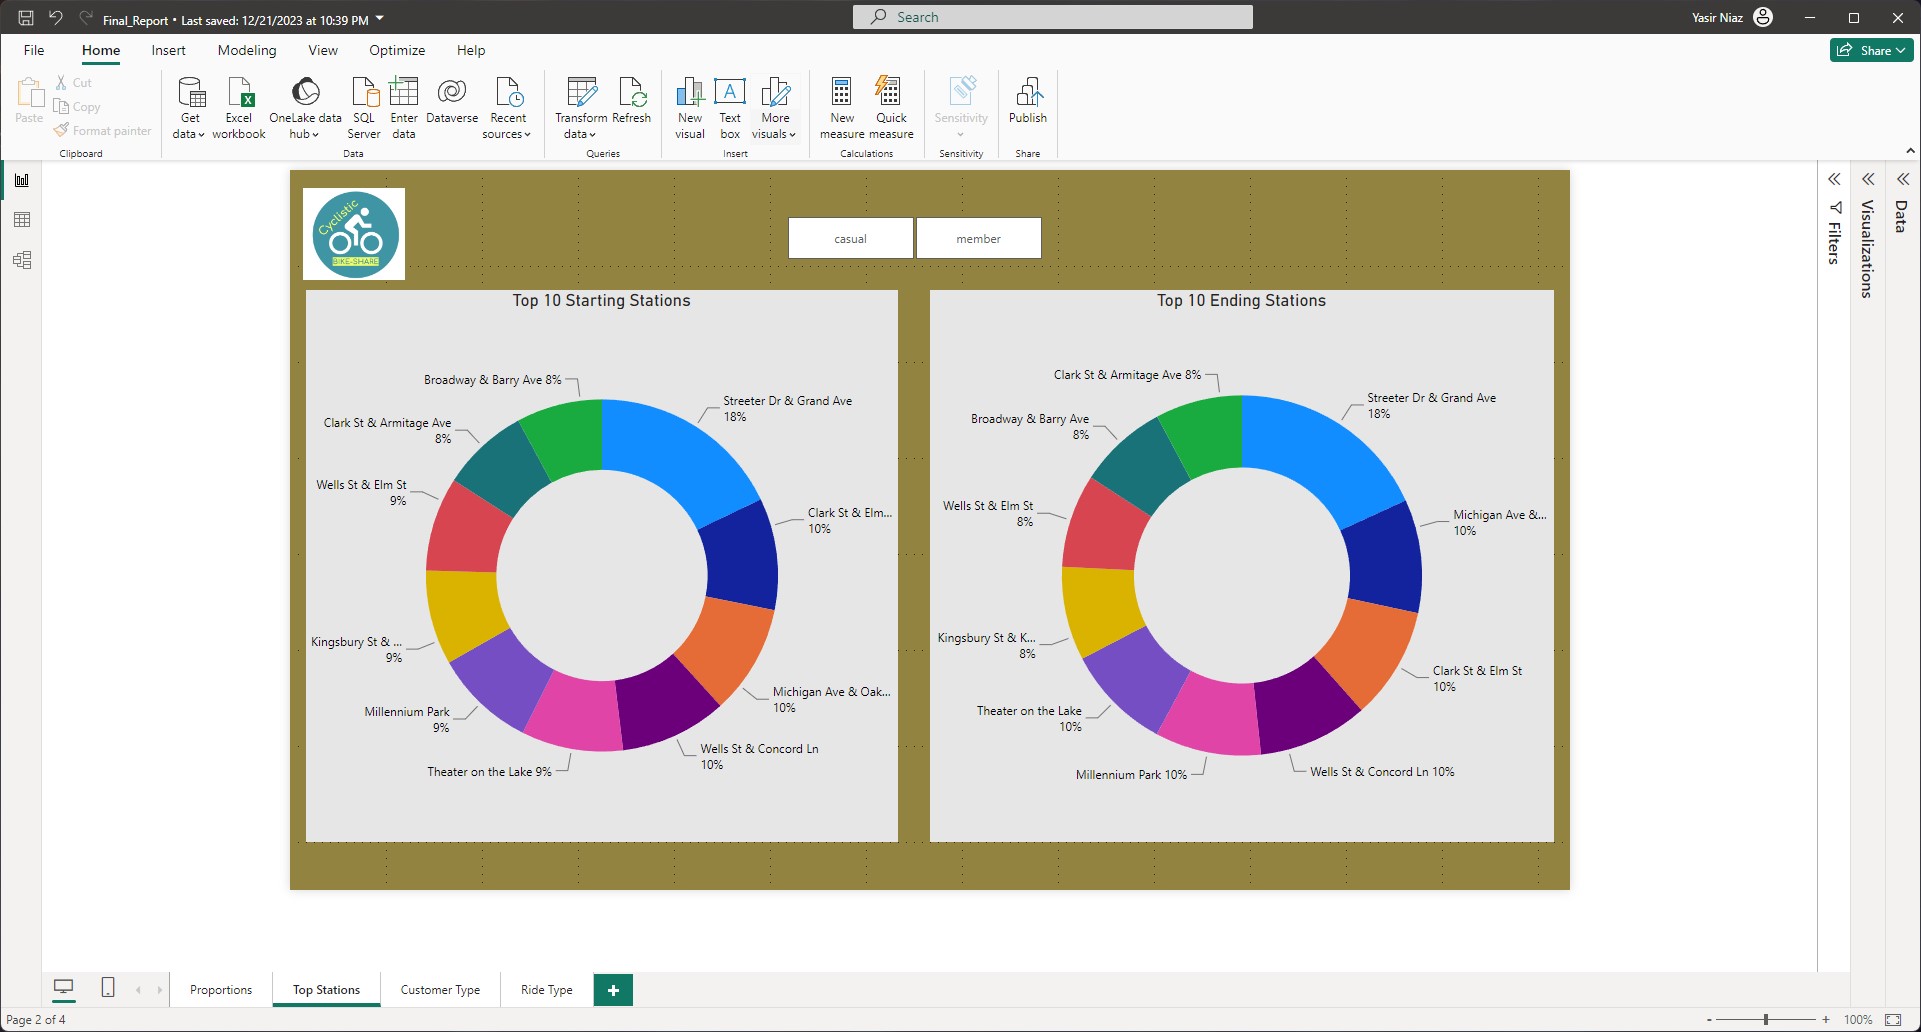
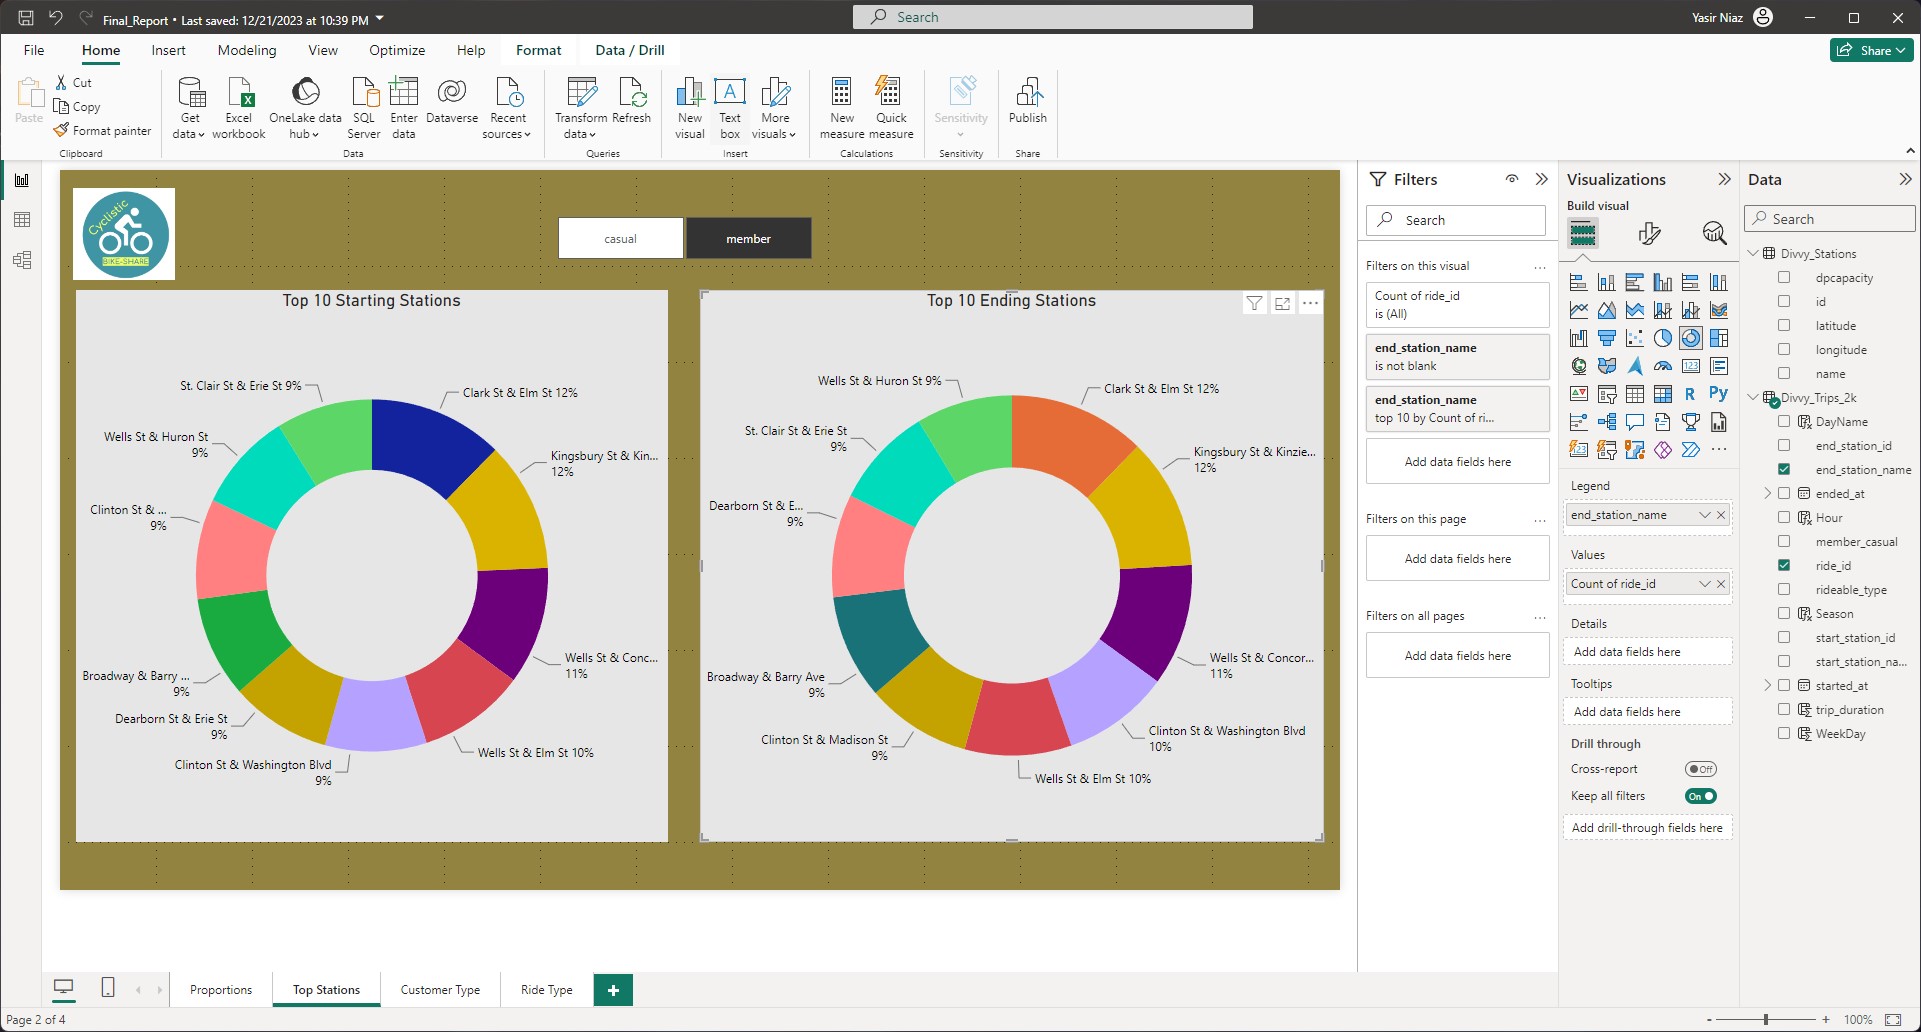
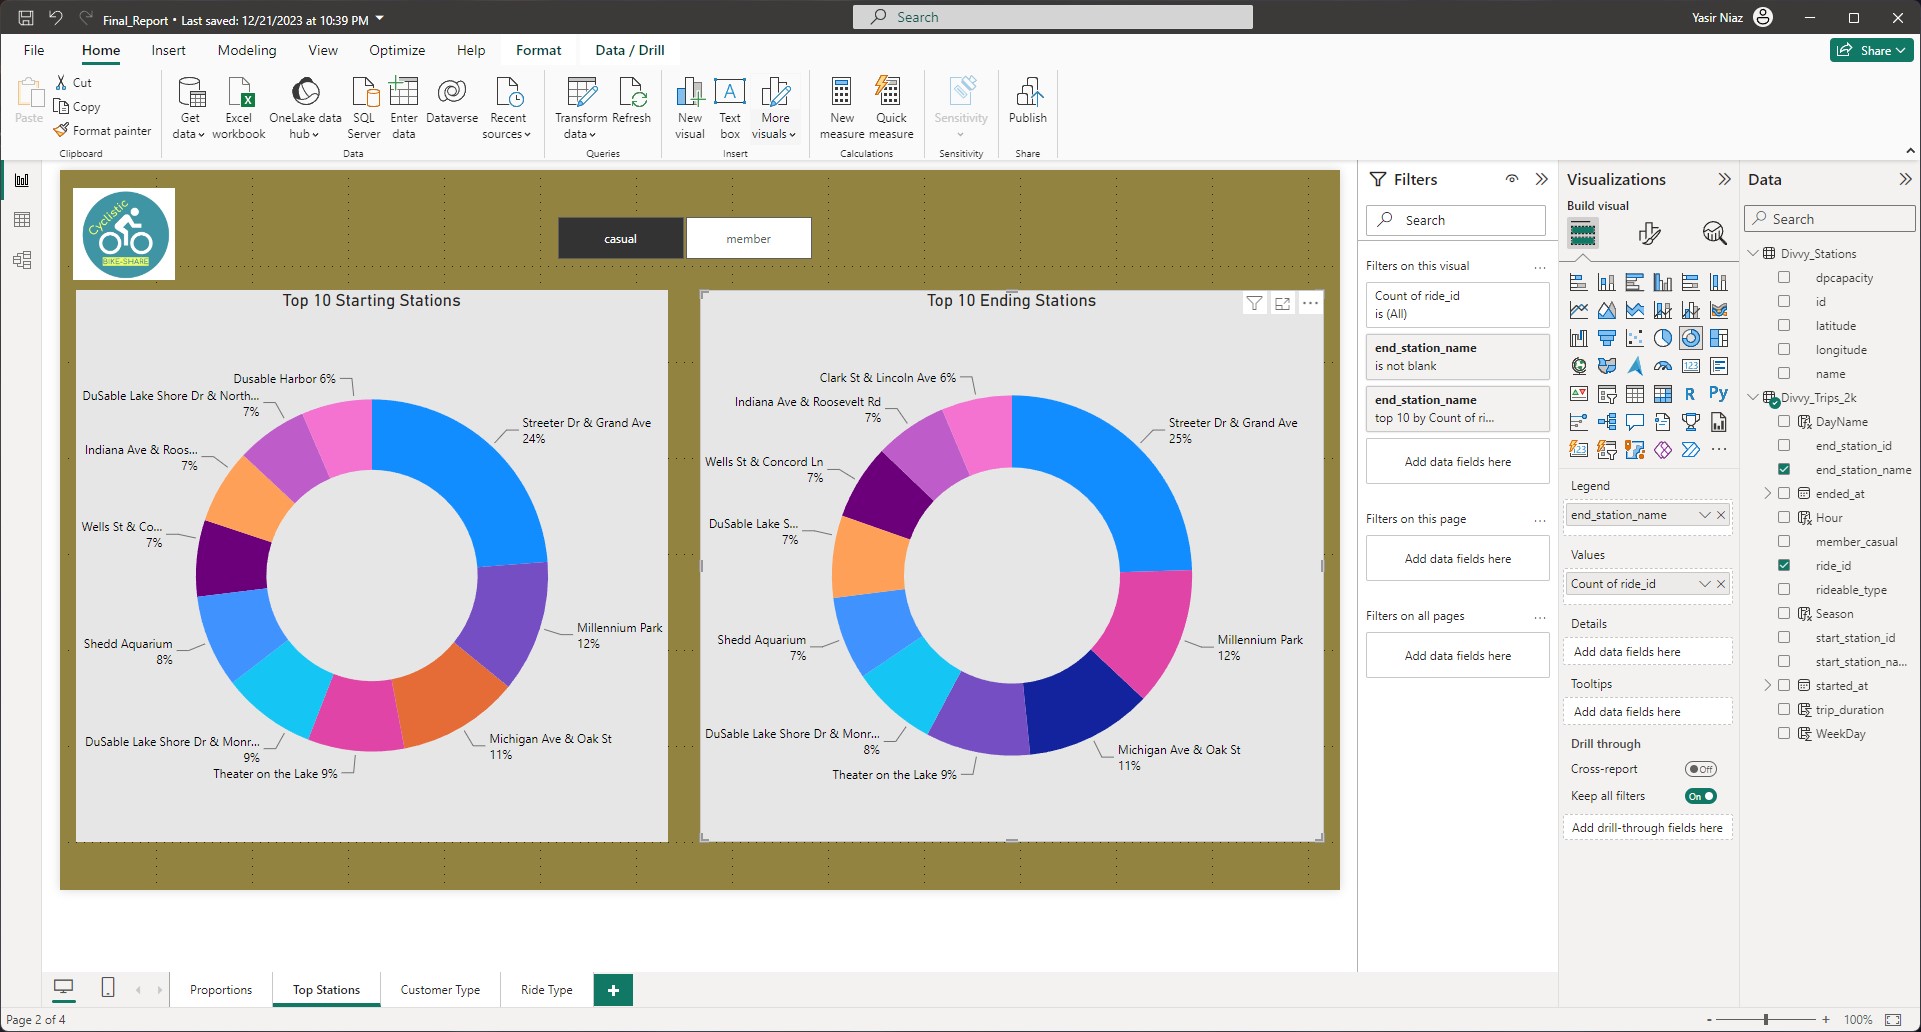
Click on the image to view it enlarged with insights.


Microsoft Power BI - Desktop
Click on the below image to view it enlarged.